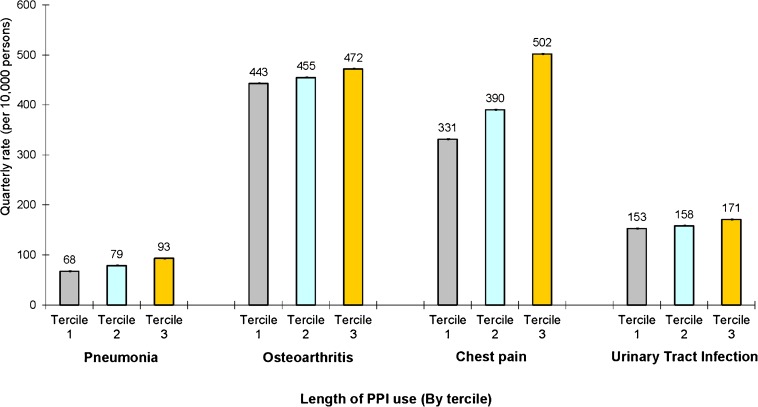
Figure 3.
Adjusted quarterly rates of community-acquired pneumonia, osteoarthritis, chest pain, and urinary tract infection medical claims, according to length of proton pump inhibitor use. This figure presents adjusted quarterly rates of each condition among users of PPIs according to tercile of use (based on number of quarters over the study period in which a prescription for a PPI was filled). Estimates are from a multivariate linear probability model with indicators for tercile of PPI use, quarterly indicators for various comorbidities, and demographic characteristics such as age, marital status, income, and geographic location. Rates are displayed at the quarterly level and are per 10,000 persons. 95 % confidence intervals reported in graph.

