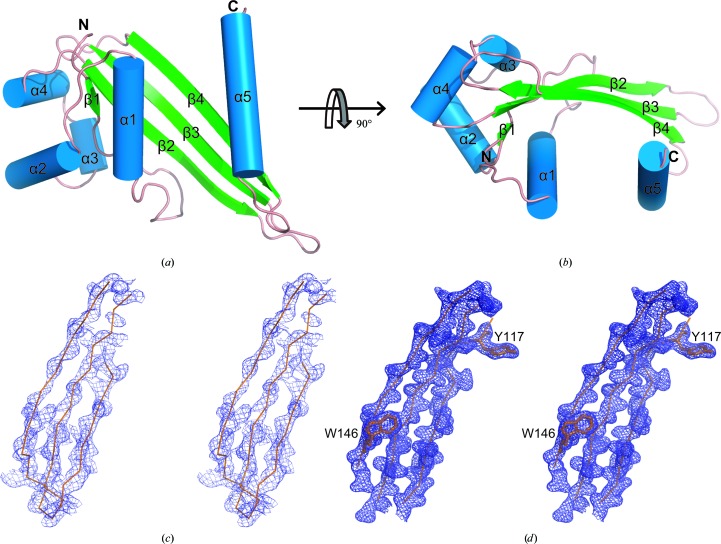
Figure 1.
Crystal structure of GNA1162. (a) A cartoon representation of the structure of GNA1162. The β-strands are shown in green, the α-helices are shown in blue and the connecting loops are shown in salmon. (b) Top view of GNA1162. The electron-density maps derived from SAD phases (c) and the final refinement (d) are shown. The maps are coloured blue and are contoured at 1.5σ.

