
Figure 4.
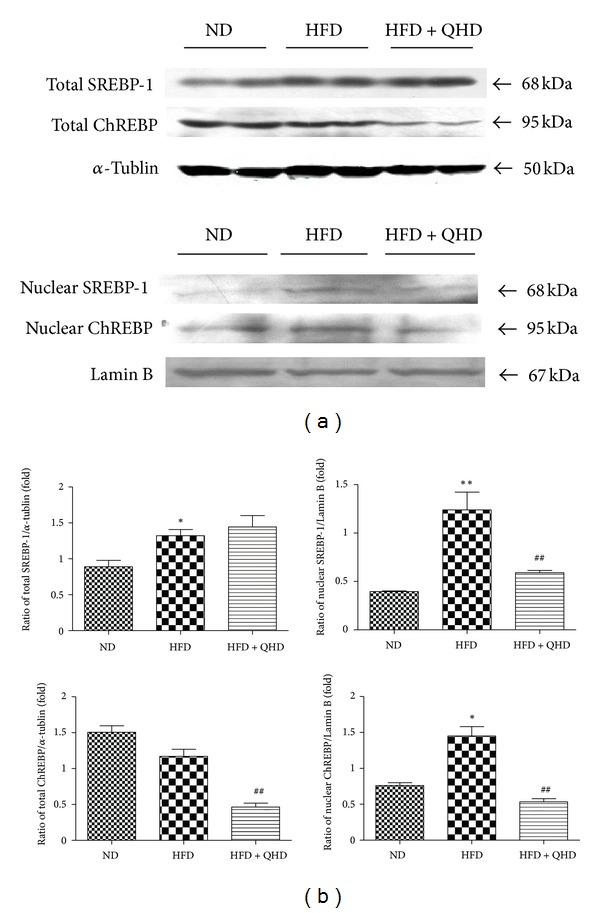
Effects of QHD on SREBP-1 and ChREBP in total and nuclear protein expressions in hepatic tissuesof HFD-fed rats. (a) Western blot. (b) Gray-level score. **P < 0.01, versus the ND group; *P < 0.05, versus the ND group; ## P < 0.01, versus the HFD group.