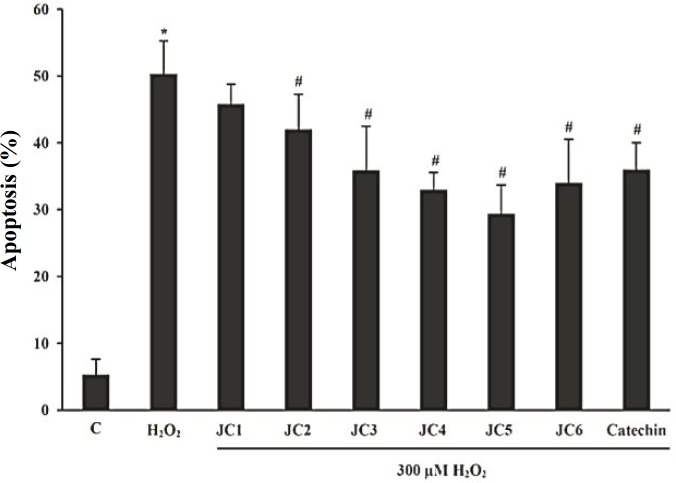
Fig. 2.
Measurement of the extent of cell apoptosis under the influence of the drugs (JC1-JC6). Cells exposed to 20 μM of each derivative for 3 h followed by exposure to 300 μM H2O2 for 24 h. Data were expressed as percentage of the apoptotic cells randomly counted in 10 microscopic fields. Catechin was used as the positive control. Each value represents the mean ± SD (n = 3). *Significantly different from control cells (P<0.05); #Significantly different from H2O2-treated cells (P<0.05).

