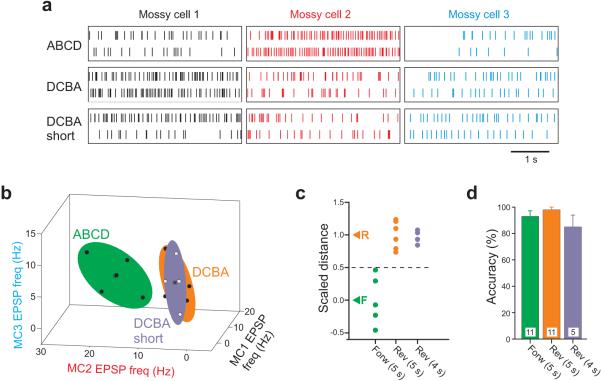
Figure 7. Sequence representations are robust to perturbation of stimulus interval.
a, Example of EPSP responses to forward and reverse sequential stimuli at 5 s intervals (ABCD, DCBA) and reverse stimuli at 4 s intervals (DCBA short) recorded in three hilar mossy cells. b, Plot of forward (black symbols within green ellipsoid), reverse (black symbols within orange ellipsoid) and reverse short (white points within purple ellipsoid) responses in EPSP frequency space in one experiment. Response centroids indicated by asterisks (reverse and reverse short centroid symbols overlap); colored ellipsoids represent 60% confidence intervals. c, Plot of scaled distance between forward (black symbols) and reverse (orange) 5 s interval sequence responses in one experiment. Responses to 4-s reverse responses (purple symbols) overlapped the 5 s reverse responses. Over 5 experiments, the mean scaled distance of the 4 s reverse points was 0.72; significantly different from 5 s forward responses (P < 0.005) and not significantly different from 5 s reverse responses (P > 0.05). d, Plot of classification accuracy for experiments with forward (green bar; n = 11), reverse (orange bar; n =11) 5 s interval sequences, and reverse sequences with 4 s intervals (purple bar; n = 5). Mean accuracies not statistically different from each other, P > 0.05. Mean ± SEM.

