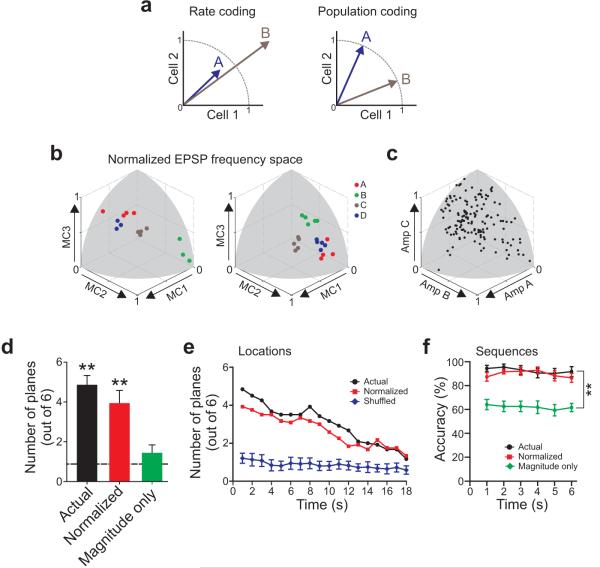
Figure 8. Population representations of stimulus and sequence identity in the dentate gyrus.
a, Diagram illustrating rate and population coding strategies. b, Plots of responses to 4 different stimulus positions in normalized EPSP frequency space from two experiments. c, Plot of all responses from 11 experiments in normalized EPSP space. Gray regions represent surface of sphere with unit radius. d, Plot of number of statistically significant LDA separation planes (P < 0.05) from all experiments with 4 different stimulus locations (Actual, n = 12), the number of planes in the same data set after normalizing vector magnitudes (Normalized), and after eliminating vector direction information (Magnitude only). Dashed line indicates mean number of significant LDA planes after shuffling stimulus identities in all 12 experiments. Mean ± SEM. ** Significantly different from shuffled stimulus identities; P < 0.0001. Both Actual and Normalized are significantly different from Magnitude only (P < 0.01); Actual and Normalized are not significantly different (P > 0.05). e, Plot of number of statistically significant LDA separation planes (P < 0.05; out of 6 possible) over time. Purple symbols indicate mean ± SD number of significant planes after shuffling the stimulus identities. Both actual (black symbols) and normalized responses (red symbols) remained significantly greater than shuffled throughout the time period examined (P < 0.05). f, Plot of accuracy of predicting sequence identity over time in control conditions (Actual, black symbols), following response normalization (red symbols) and using only vector magnitude information (green symbols). Both control (Actual) and Normalized conditions are significantly different from the Magnitude only condition at all time points. ** P < 0.002.

