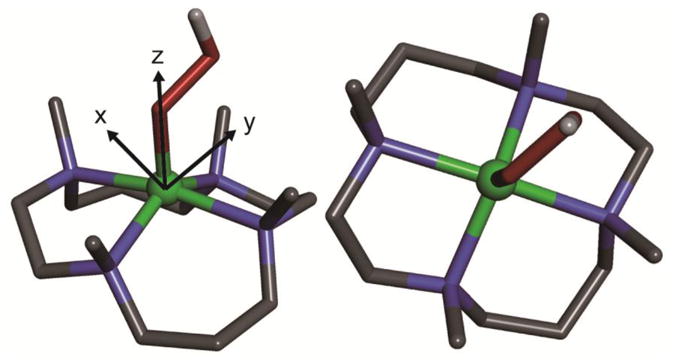
Figure 1.

DFT optimized structure of the [(TMC)FeIII–OOH]2+ complex (left, side view; right, top view). Fe atom is in green, N atoms are in blue, C atoms are in black, O atoms are in red, H atom is in white. Only the H atom on the OOH ligand is shown, whereas other H atoms are omitted for clarity. The coordinate system is shown in the left panel, where z-axis is defined as along Fe–O bond, y-axis and x-axis are in and perpendicular to the Fe–O–O plane, respectively.
