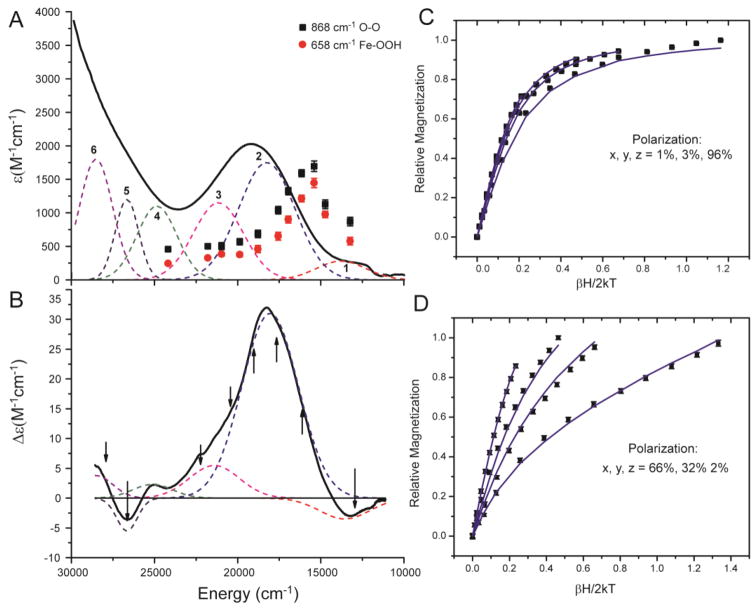
Figure 3.
(A and B) UV-vis absorption (A, 10 K) and MCD (B, 5 K and 7 T) spectra of the [(TMC)FeIII–OOH]2+ complex with simultaneous best Gaussian fit (bands 1 – 6). Arrows in the MCD spectrum indicates energies where VTVH MCD data were collected. Resonance Raman profiles of ν(O–O) (868 cm−1, black rectangles) and ν(Fe–OOH) (658 cm−1, red circles). (C and D) VTVH MCD isotherms (black rectangles) and best fits to the data (blue lines). Data were collected at 1.8, 3.5, 5, and 10 K. VTVH MCD taken at 17794 cm−1 (C) and 22124 cm−1 (D).

