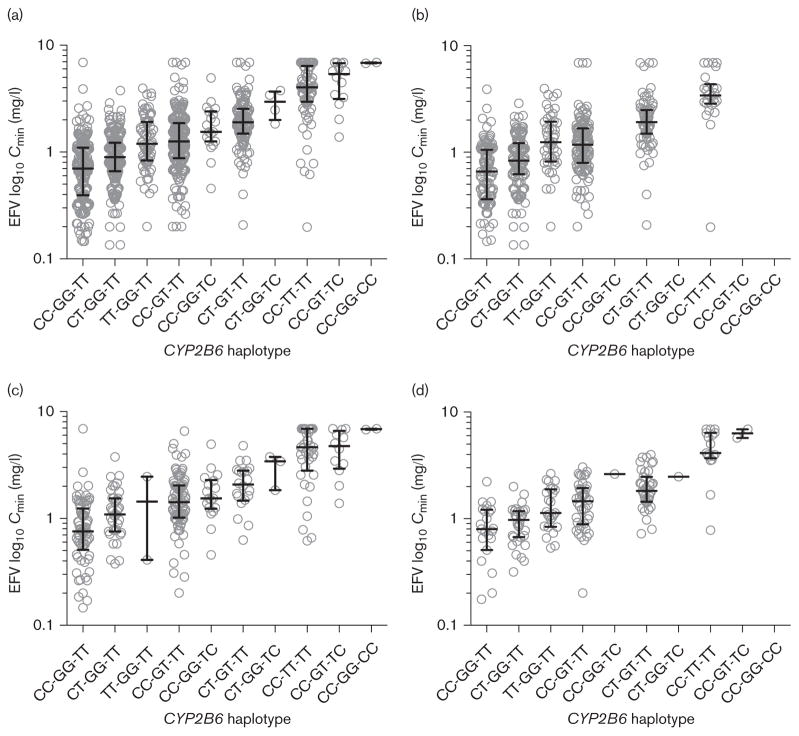
Fig. 3.
Relationships with CYP2B6 variants and efavirenz estimated Cmin values. Efavirenz Cmin values were estimated as described in the Materials and Methods section. (a) All participants (self-identified white, black, and Hispanic); (b) Self-identified white participants; (c) Self-identified black participants; (d) Self-identified Hispanic participants. On x-axis, CYP2B6 haplotypes represent (in order) CYP2B6 rs4803419 C→T (CC, CT, TT), 516G→T (GG, GT, TT), and 983T→C (TT, TC, CC). The need to convert measured efavirenz concentrations to percentiles to derive estimated Cmin values creates a spurious plateau of concentrations at approximately 7 mg/l. Actual Cmin values for some individuals undoubtedly exceed this value.

