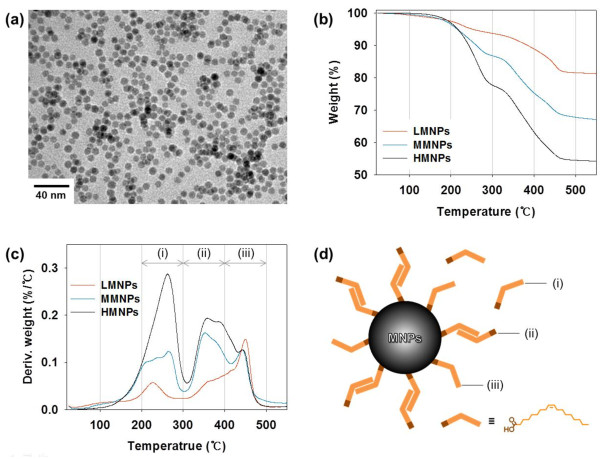
Figure 2.
Characterization of PMNPs. (a) Transmission electron microscopy image of MNPs. (b) Thermogravimetric analysis shows weight change in relation to temperature of the three PMNPs containing different amounts of primary ligand (oleic acid). (c) Derivative weight curves of the three PMNPs (LMNPs, MMNPs, and HMNPs). (d) Illustration of the interactions of oleic acid on MNPs.

