
Figure 3.
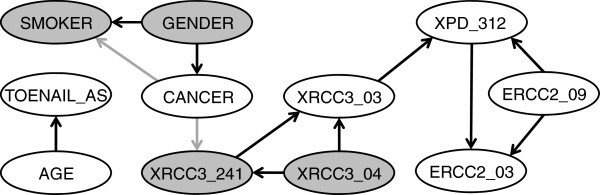
A non-causal network. Edges that differ relative to the causal networks are indicated in grey. Shaded nodes indicate the Markov blanket of CANCER.
Official websites use .gov
A
.gov website belongs to an official
government organization in the United States.
Secure .gov websites use HTTPS
A lock (
) or https:// means you've safely
connected to the .gov website. Share sensitive
information only on official, secure websites.
A non-causal network. Edges that differ relative to the causal networks are indicated in grey. Shaded nodes indicate the Markov blanket of CANCER.