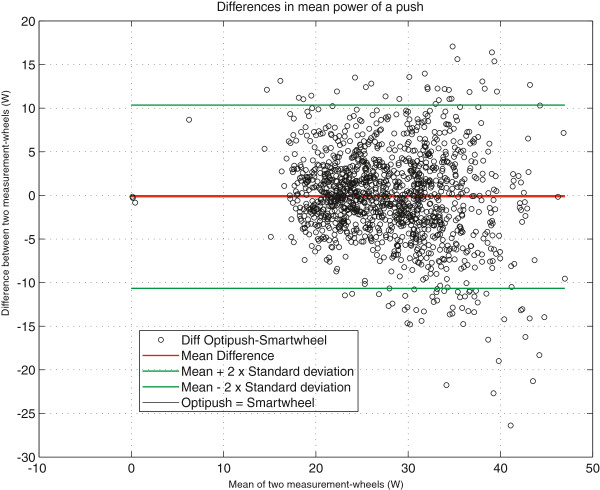
Figure 4.
Bland-Altman plot of all pushes, for all practice blocks of all subjects. Each push of the Optipushb is matched to the simultaneous one of the Smartwheela. For each push the difference of the two is plotted against the mean of the two (black circles). It is clearly seen that they differ a lot on individual pushes, but on average (red line) there is no clear systematic difference between the wheels.

