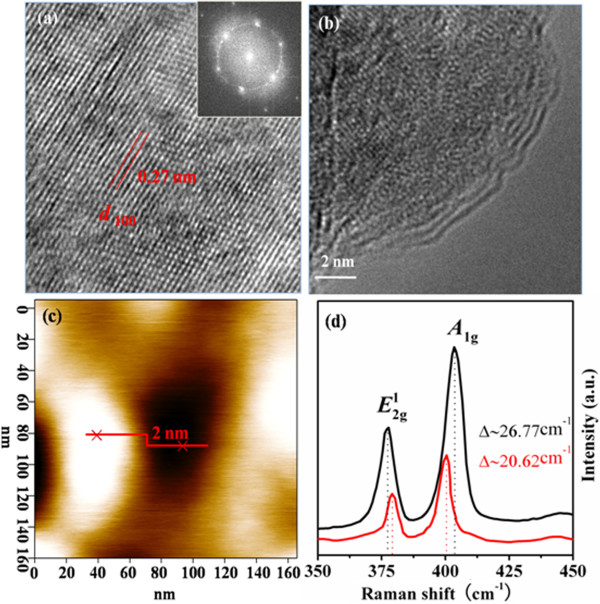
Figure 3.

HRTEM, TEM, and AFM images and Raman spectra of MoS2 nanosheets and MoS2 powder. (a) The HRTEM image of exfoliated MoS2 nanosheets (10 h); the d100 is 0.27 nm. The inset is the FFT pattern of the sample. (b) Marginal TEM image of exfoliated MoS2 nanosheets (10 h). (c) Tapping mode AFM image of the exfoliated MoS2 nanosheets (10 h). (d) Raman spectra for the pristine MoS2 powder and exfoliated MoS2 nanosheets (10 h).
