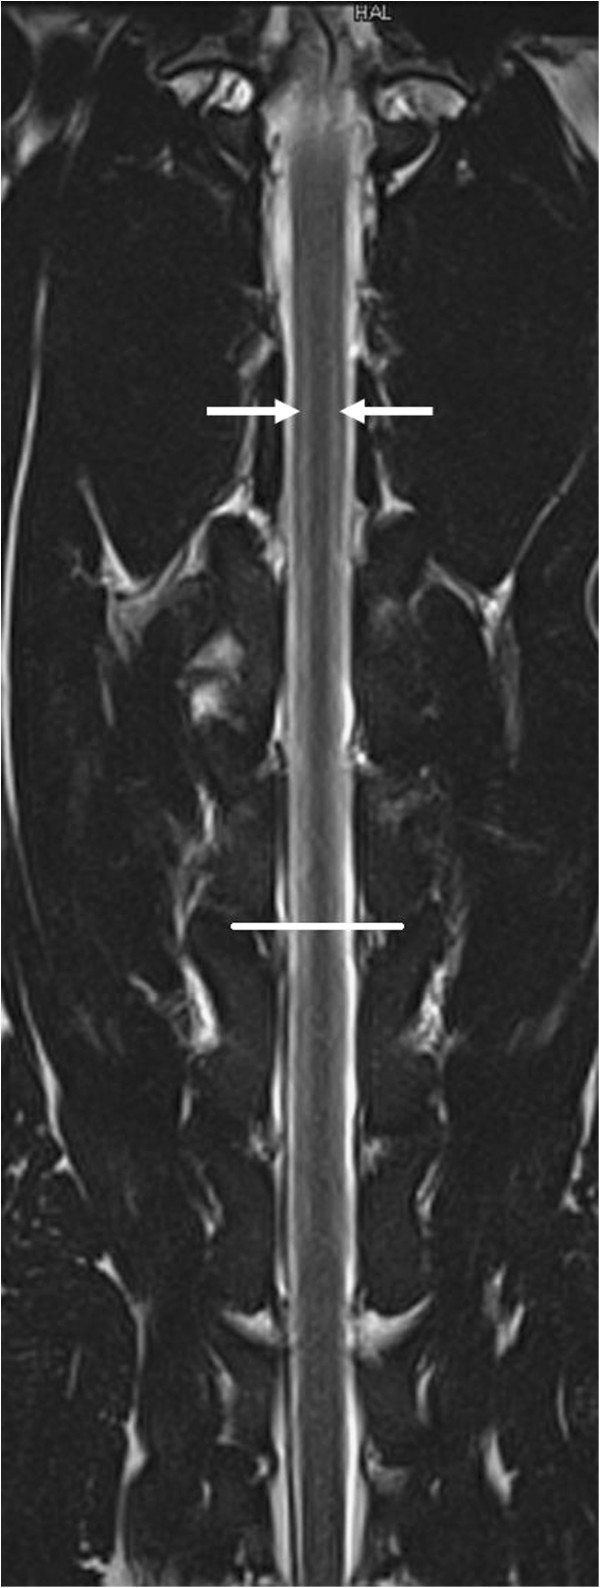
Figure 2.

Dorsal T2-weighted MR images of the cervical spinal cord. The image shows linear, hyperintense signals (arrow) corresponding to the lesions in Figure 1 that extend from the level of the first to the sixth cervical vertebral body in a bilateral, symmetrical fashion. The line denotes the C4-C5 intervertebral disk space.
