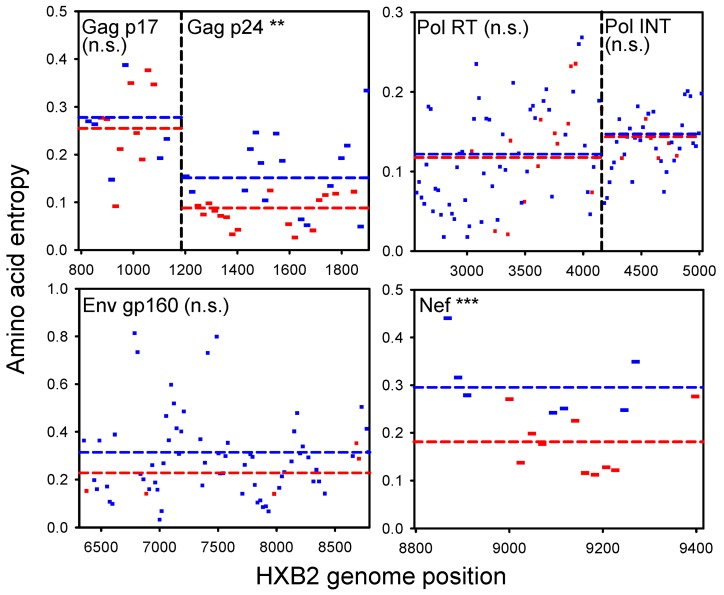
Figure 2. Association between amino acid variability and T-cell immunogenicity in HIV-1 subtype C using data from a high-throughput study [18], controlling for epitope detection bias (see text).
The average entropy (H) is shown for peptides that produced at least one positive immune reaction (red) versus those showing no reactivity (blue). Only genes with at least five peptides in each category are shown. Genome regions with overlapping reading frames were excluded. Dotted lines indicate ANOVA-estimated marginal means. ** 0.001<p<0.01; *** p<0.001. n.s., not significant.

