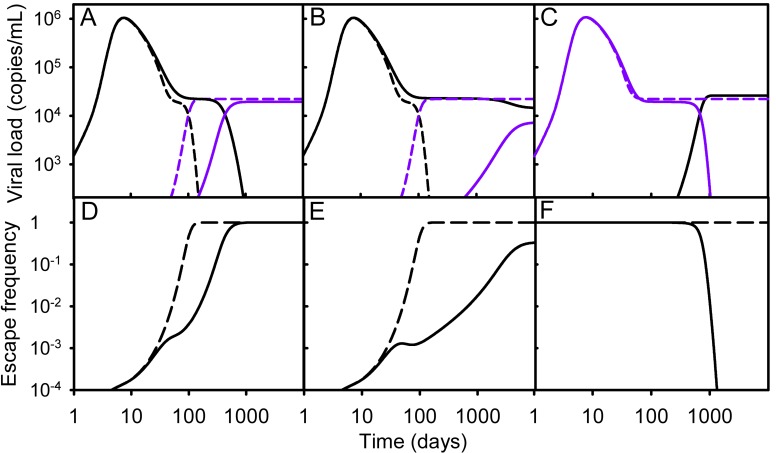
Figure 4. Simulated viral load versus time for combinations of parameter values producing biologically meaningful peak loads, viral loads at set point (copies/mL), and escape rates (days−1).
In top panels, wild-type and T-cell (CTL/TH) escape variants are shown in black and purple, respectively. Solid lines refer to the HIV model, whereas dashed lines correspond to the control model. HIV-specific activation rate constants (a4, a8, a8D, a8′), the background activation rate constant (b), and transinfection probability (d) were as indicated below, whereas all other parameters values were set as indicated in the text. (A) a4 = a8 = a8D = a8′ = 0.1, b = 0.001, d = 0.03; (B) a4 = a8 = a8D = a8′ = 0.1, b = 0.001, and d = 0.037; (C) a4 = a8 = a8D = a8′ = 0.15, b = 0.001, d = 0.03, and the infection was started with a T-cell escape mutant. (D, E, and F) Changes in the intrapatient frequency of the escape mutant for the HIV (solid) and control (dashed) models obtained in (A), (B), and (C), respectively. (D) The calculated rate of escape, as defined in previous work [50], was 0.012 day−1 in the HIV model and 0.091 day−1 in the control model. (E) The escape mutant reached a stationary frequency of 0.324 in the HIV model and became fixed in the control model (fixation rate: 0.091 day−1). (F) The escape mutant was selected against and reverted to the wild-type in the HIV case (reversion rate: 0.012 day−1), whereas it remained fixed in the control model.

