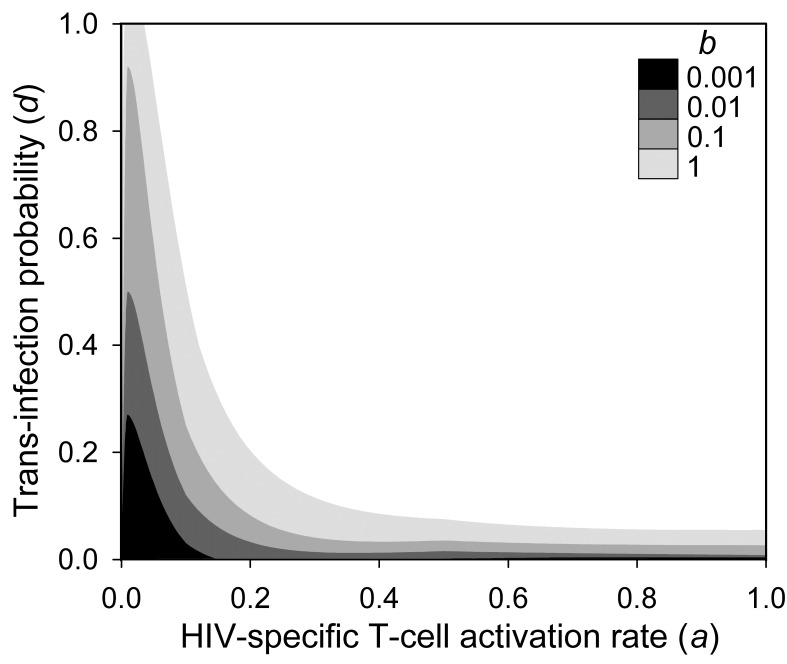
Figure 5. Immune escape dependence on the HIV-driven T-cell activation rate constant (a4), trans-infection probability (d), and background activation (b).
Shaded areas indicate parameter combinations for which T-cell escape mutants became dominant (frequency >0.5) after t = 1000 iterations (days). T-cell activation rate constants were set equal to one another (a8 = a8D = a8′ = a4), and the rest of parameter values were as indicated in the text.

