
Figure 1.
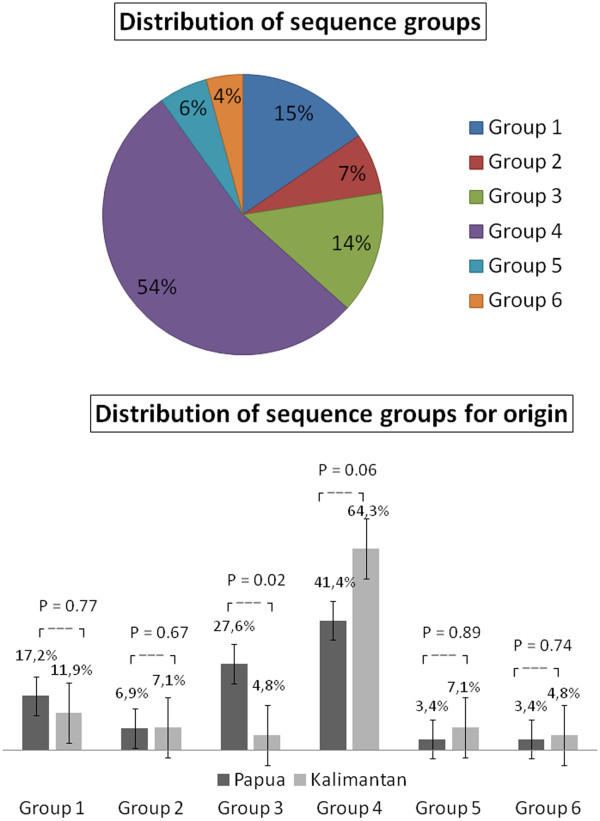
Distribution of DBL1α sequences from gDNA into six sequence groups based on Cystein/PoLV classification. Upper part: The pie chart represents the overall distribution of sequence groups in all 71 sequences from eight isolates. Lower part: Black bars represent DBL1α sequences from isolates from Papua. Grey bars represent DBL1α sequences from Kalimantan. There is statistical evidence for a difference in distribution between the two areas. Group 3 is more prevalent in isolates from Papua. Group 4 is the most prevalent in both areas.