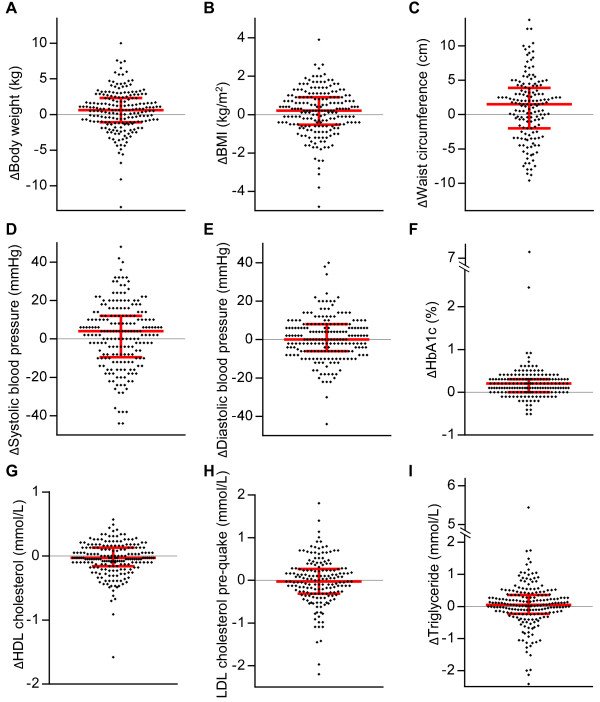
Figure 3.
Scatter plots of differences in the screening variables before and after the earthquake. Scatter plots of body weight (A), BMI (B), waist circumference (C), systolic blood pressure (D), diastolic blood pressure (E), HbA1c (F), HDL cholesterol (G), LDL cholesterol (H), and triglyceride (I) are shown. Red bars indicate the median and interquartile range.

