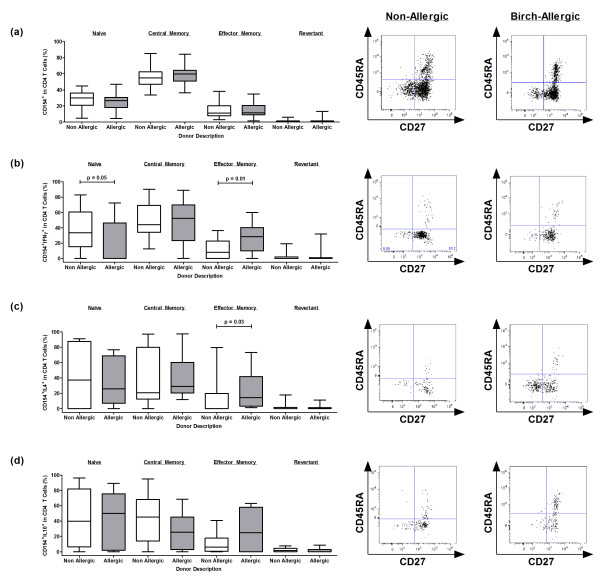
Figure 7.
Phenotypic analysis of birch-stimulated T cell populations based on CD27 and CD45RA cell surface expression. Data represents the phenotype and representative raw data of (a) CD154, (b) CD154+IFNγ+, (c) CD154+IL-4+ and (d) CD154+ IL-10+ T cells responses in non-allergic and birch-allergic individuals, expressed as the background-corrected percentage of positive cells of the total responding CD4 T cell population. CD154+ and CD154 + cytokine + T cell populations were initially calculated using Boolean gating and subsequently analysed for CD27 and/or CD45RA expression.

