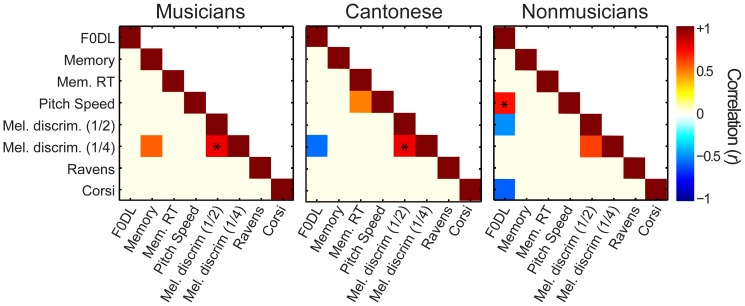
Figure 5. Correlations between perceptual and cognitive abilities.
. Cells of each matrix represent the correlation coefficient (Pearson’s r) between pairs of tasks where the color denotes the magnitude of correspondence. Warmer colors denote positive associations; cooler colors denote negative associations. Correlations are threshold at p < 0.05 (uncorrected) such that only significant cells are visible. Starred cells denote correlations surviving correction for multiple comparisons using a false discovery rate of α = 0.05 [89].

