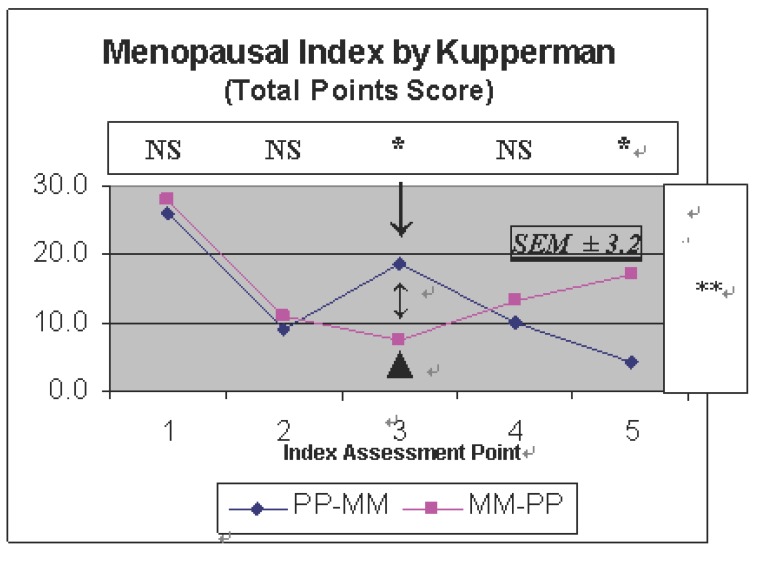
Figure 2.
Menopausal Index according to Kupperman as determined in two groups of perimenopausal women (n=18): after administration of 2,000 mg Maca-GO daily at: 1) Start - before the trial; 2) after subsequent one month and 3) two months administration of Placebo or Maca-GO (Treatment A - without prior run-in period), with crossover (marked by arrows) after completion of the Period A, followed by another two months (4 & 5 respectively) of administration of the same quantities of daily dose with the change from Placebo to Maca-GO and vice-versa (Treatment B - with prior run-in period). Symbol “Δ” indicates a crossover (X) point. Statistical significance: The value 3.2 = calculated Standard Error of Mean (SEM ±); Panel above the diagram, indicate difference between Maca-GO and Placebo Treatments (A and B respectively); *P<0.05; **P<0.01 and NS, Not Significant. The right hand side panel, indicates significance of differences between the scores obtained along the subsequent assessment points (between and within the PP-MM and MM-PP Treatments).

