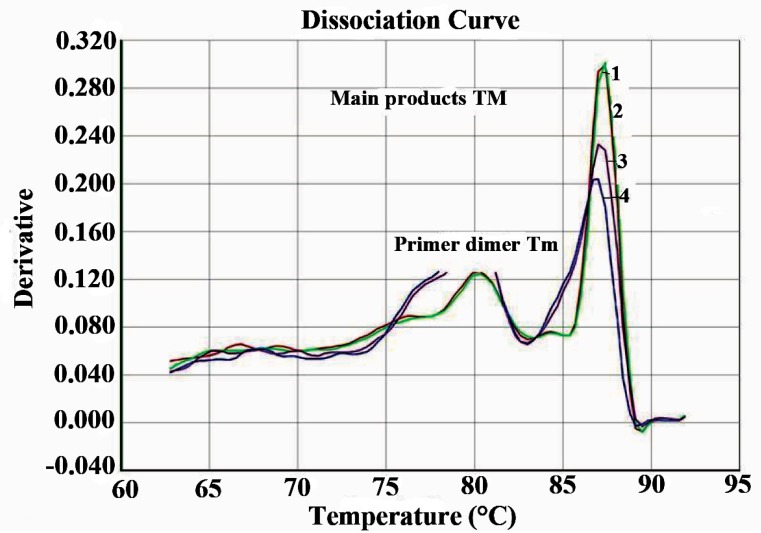
Figure 5.
Melting curve analysis by real time PCR. Derivatives, displays a plot of the first derivative of the rate of change in fluorescence as a function of temperature; 1, negative (H2O); 2-5, positive with NG1 and NG2 primer specific for genus Nocardia; 6, M. tuberculosis H37Rv; 7, DNA from M. tuberculosis.

