
Figure 3.
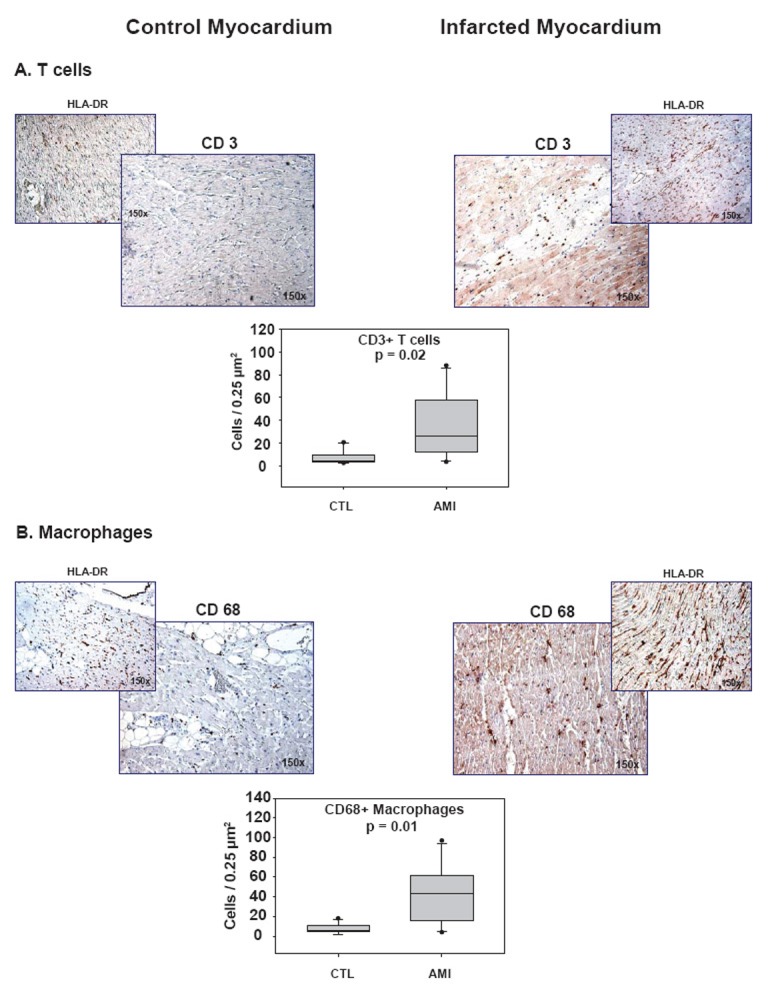
Presence of T cells and macrophages in infarcted myocardium. Images of immunostainings of (A) T cells (CSA, CD3+, Dako, 1:80) and (B) macrophages (CSA, Dako, CD68+, prediluted) together with HLA-DR expression (CSA, 1:25) in control (CTL) and infarcted (AMI) myocardium and corresponding histographical presentation. Statistical analysis by Mann-Whitney Rank Sum Test