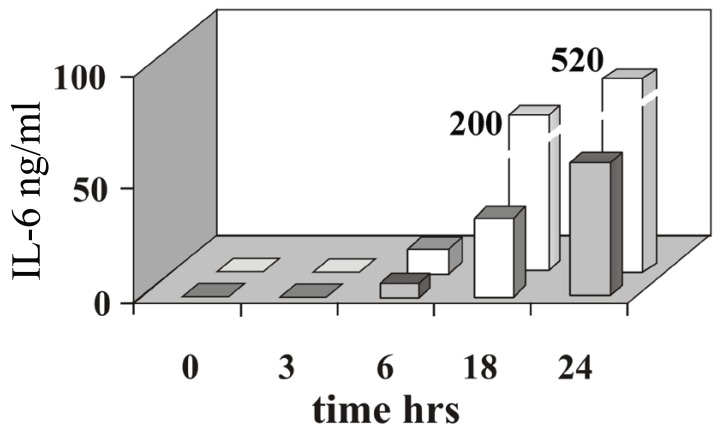
Figure 3.
IL-6 induction triggered by TNFα or IL-1β IL-6 (ng/ml) detected by ELISA in the culture medium of cell treated with TNFα (grey) or IL-1β (white), at the time indicated after cytokine induction. Bars representing IL-6 after 18 and 24 hours of incubation with IL-1β are not in scale, the actual values correspond to 200 ng/ml and 520 mg/ml, respectively. The data shown in the figure are representative of three independent experiments.

