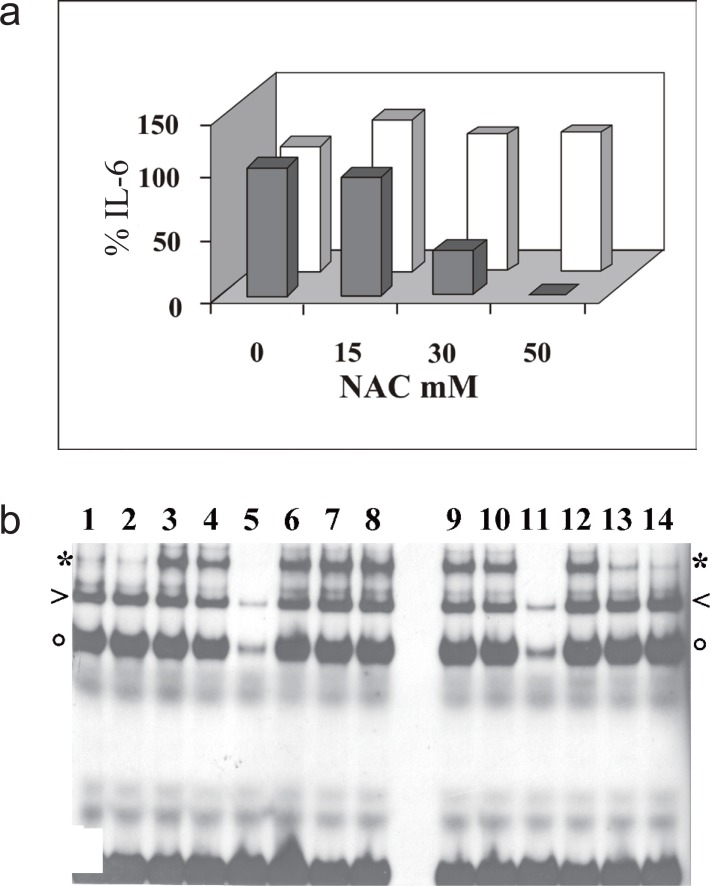
Figure 5.
IL-6 induction by TNFα or IL-1β in MG-63 cells in the presence of NAC. a, IL-6 detected by ELISA in the culture medium of cell treated for 6 hours with TNFα (gray) or IL-1β (white), one hour after addition of NAC. Bar height represents the percentage of IL-6 secreted at the indicated concentration of NAC, relative to the value determined in the absence of NAC, taken as 100%; b, EMSA analysis of MG-63 nuclear extracts with the IL-6κB radioactive probe. Cells were treated for 6 hours with IL-1β (3-8) or TNFα (9-14), one hour after addition of NAC (6, 12 15mM, 7, 13 30mM, 8, 14 50mM). To check binding specificity, 100 fold excess of IL-6κB cold oligonucleotide was added to lanes 5 and 11. Complexes of NF-κB heterodimer, p50 dimer or CBF1 are indicated by asterisk, arrowhead or circle, respectively. The data shown in the figure are representative of three independent experiments.

