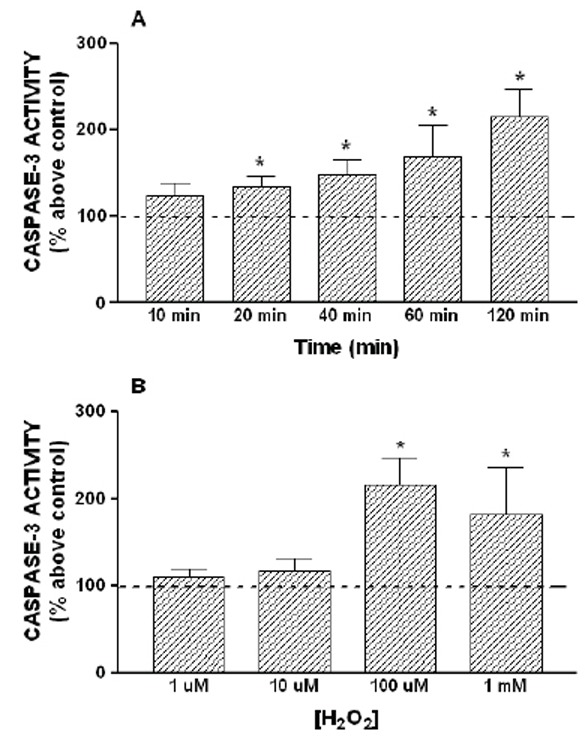
Figure 2.

Time course and concentration dependence of H2O2-induced activation of caspase-3. HL-60 cells were stimulated for various periods of time (10–120 minutes) with 100 μM H2O2 (A) or for 120 minutes with increasing concentration of H2O2 (1 µM–1mM) (B). Caspase-3 activity was estimated as described under “Material and Methods”. Values are presented as means ± SEM of 5–8 separate experiments and expressed as percentage above control (untreated samples). *p<0.05 compared to control values.
