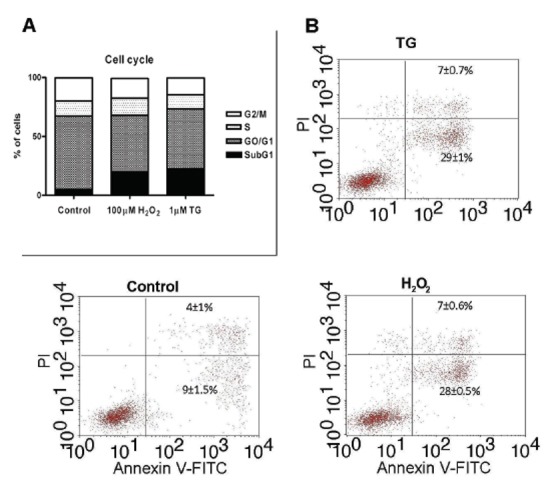
Figure 6.

Effect of H2O2 on apoptosis induction in HL-60 cells. Cells were stimulated with 100 µM H2O2 for 120 min or 1 µM thapsigargin (TG) for 60 min. The cell cycle phase distribution was determined by flow cytometry analysis using ethanol-fixed, propidium iodide (PI)-stained cells (A). To determine the relationship between apoptosis and necrosis, cells were stained with annexin-V-FITC and propidium iodide (PI) and analyzed by flow cytometry (B) as described under “Material and Methods”. Values are presented as mean percentages ± S.E.M. of 3–4 separate experiments.
