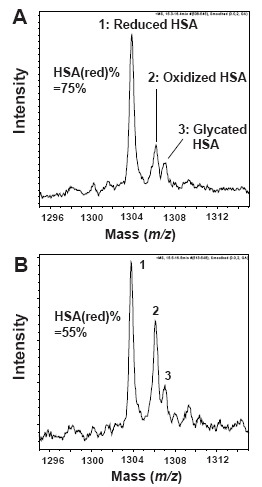
Figure 1.

ESI-TOF mass spectra of human serum albumin. All observed peaks in this mass range (m/z 1295–1315) were charged [M+51H]51+ albumin ions. A, Spectrum of HSA in fresh plasma; B, Spectrum of HSA; incubation for 2 h at 37°C after blood collection. Assigned numbering peak; 1, reduced HSA (HSA(red)); 2, oxidized HSA (HSA(ox):cysteinylated HSA); 3, glycated HSA. HSA(red)% is defined by following formula. HSA(red)% = [(peak 1 height)/(peak 1 height + peak 2 height)] × 100.
