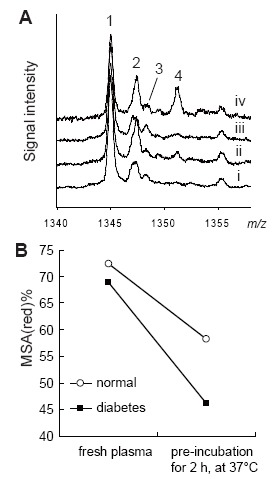
Figure 4.

Changes in the profile of mouse serum albumin, with or without pre-incubation. A, LC-ESI-TOFMS spectra of mouse serum albumin (MSA: m/z 1340–1358). In this m/z range, all observed Alb ions were charged [M+50H]50+ MSA ions. Line i is normal mouse plasma without pre-incubation. Line ii is normal mouse plasma with pre-incubation for 2 hour at, at 37°C). Line iii is KK-Ay (diabetes model) mouse plasma without pre-incubation. Line iv is KK-Ay mouse plasma with pre-incubation for 2 hour at 37°C. 1, reduced form MSA; 2, Cys addition MSA, 3, glycated MSA; 4, glutathione addition MSA; B, The shift in MSA(red)% values with or without preincubation (for 2 h, at 37°C).
