
Figure 1.
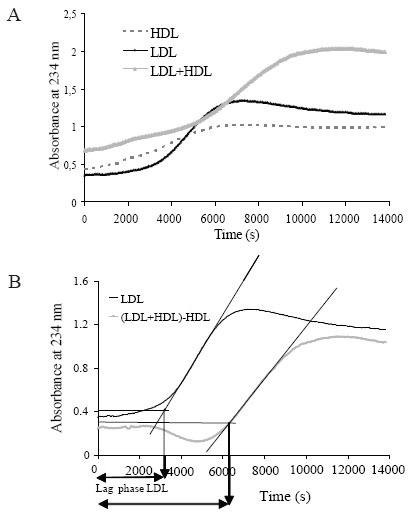
A) Representative oxidation kinetics of LDL (continuous black line), HDL (dashed line) and LDL+LDL (continuous grey line). LDL and HDL (at 0.1 g/L of apoB and apoA-I, respectively) were oxidized in presence of 5 μmol/L CuSO4. Lipoproteins were previously dialyzed in PBS; B) Calculation of lag phase time. HDL curve was subtracted from (LDL+HDL) curve, and the curve corresponding to (LDL+HDL)-HDL was obtained. Lag phase time was calculated as shown in the figure and explained in Methods. Maximal slope was considered using 30 consecutive points in the propagation phase.