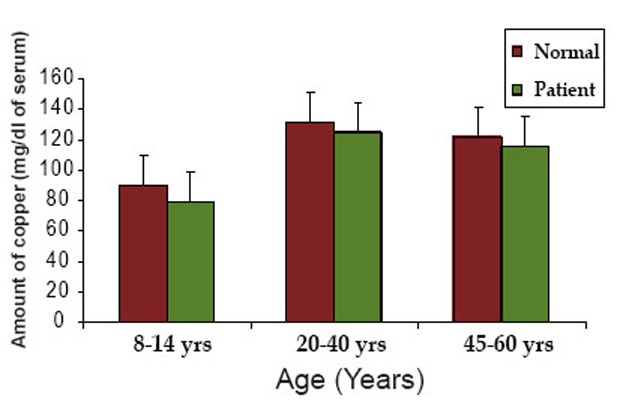
Figure 2.

The graphical representation of the comparative levels of copper content in normal individuals and neurological patients.

The graphical representation of the comparative levels of copper content in normal individuals and neurological patients.