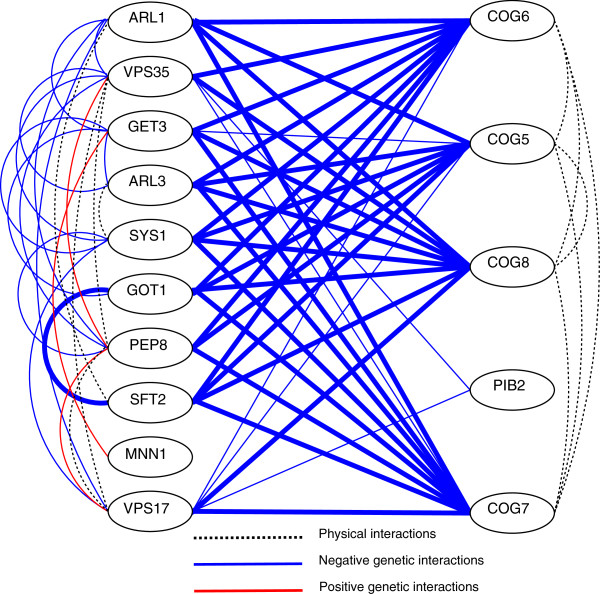
Figure 2.
Sample of physical and genetic interactions of a BPM. Genetic interactions appear as solid lines. Thicker lines correspond to more negative weights. Dashed lines correspond to known protein-protein interactions. (Protein-protein interactions were taken from BioGRID’s data, with the “low-throughput” filter active).

