
Figure 3.
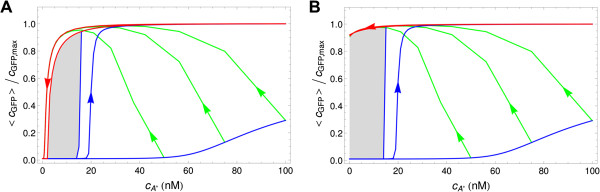
Response curves to autoinducer induction in the population-average model.lux01 (A) and lux02 (B) operons. The normalized GFP concentration is plotted as a function of the exogenous autoinducer concentration : steady-state response for increasing (arrow-free upper blue curve) and decreasing (arrow-free red curve) autoinducer concentration, response under 10 h induction time for increasing (blue curve with arrow) autoinducer concentration, transient response after 2 hours of induction (lower blue curve) from initially non-induced cells, decreasing-concentration trajectories (green curves) for cells weakly induced (2 hours) at , 75 nM and 50 nM, and decreasing-concentration trajectories (red curve with arrow) for cells fully induced (10 hours) at . The decreasing-concentration trajectories reduce the value of hourly by 25% (similar to the experiments in [10]). The gray-shaded region between the increasing and decreasing steady-state curves reveals bistability in the range (lux01) and (lux02).