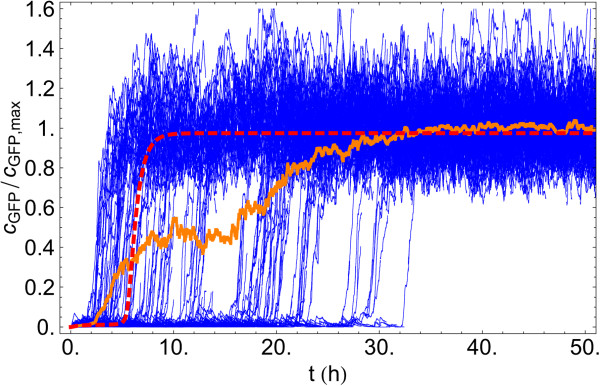
Figure 5.
Individual cell trajectories for autoinducer induction in the stochastic model. Individual cell trajectories (blue lines), cell population average (orange line) and deterministic solution (red dashed line) for an induction experiment at for the lux01 operon in the stochastic model. Individual cell trajectories show the heterogeneous distribution of cell jumping times. While some cells achieve full induction of the operon before the deterministic case, the global response of the population reaches steady-state at ∼30 hours, slower than the deterministic solution.

