
Figure 8.
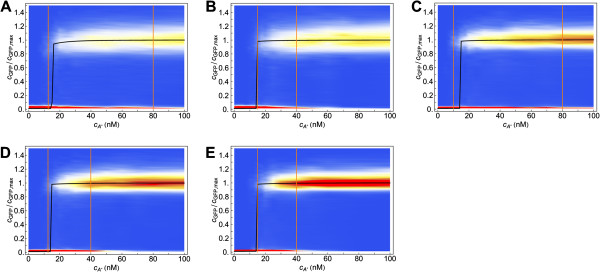
Cell response distribution in the transient regime for different burst size values. Cell response distribution (jumping probability) after 10 hours of induction (transient state) at different autoinducer concentrations for the lux02 operon in the stochastic model and different burst sizes. Burst size values (A) bR=bI=20 (B) bR=4,bI=20 (C) bR=20,bI=4 (D) bR=bI=4 (E) bR=bI=0.01. Width of bistable region: (A) = 60 nM (B) 25 nM (C) 70 nM (D) 27.5 nM (E) 25 nM. The black line stands for the concentration of GFP (normalized) as a function of in the deterministic model at the steady state.