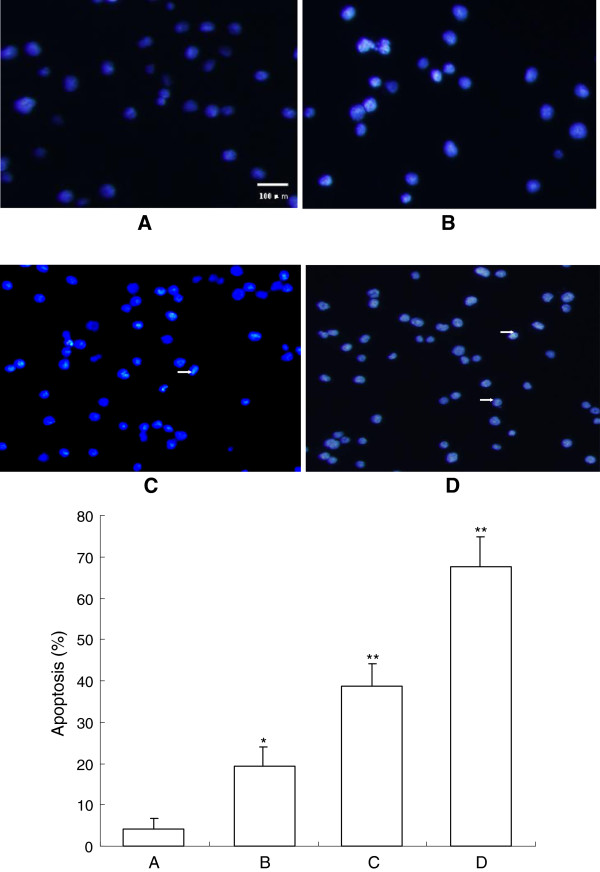
Figure 3.
Cell apoptosis observed by Hoechst 33258 staining using a fluorescence microscope (200×). After cells were treated with different dose of β-elemene for 72 h, Hoechst 33258 staining was used to observe the apoptotic cells under a BX-60 fluorescence microscope. Values represent mean ± SEM from three independent experiments. A: blank control group; B: 10 μg/mL β-elemene group; C: 20 μg/mL β-elemene group; D: 40 μg/mL β-elemene group. *P<0.05, **P<0.01 versus blank control group. The arrow shows apoptotic cells.

