
Figure 4. Multi Frequency Phase Fluorimetry PO2 vs. Clark-type Electrode PO2 (human blood ex vivo, hypoxic and normoxic range).
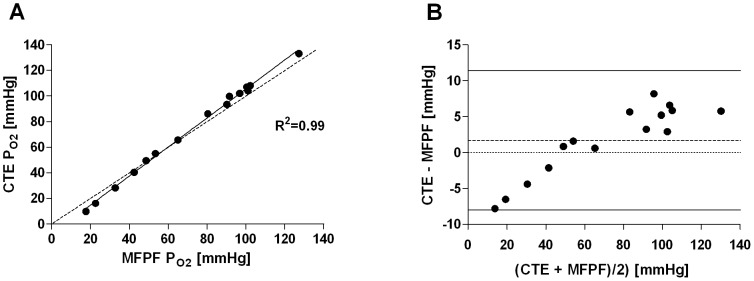
Panel A: Linear regression plot, the solid line displays the line of best fit, the dashed line shows the line of identity; Panel B: Bland-Altman plot showing the differences (CTE-MFPF) versus the means for absolute PO2 values. The dashed line represents the bias, the solid lines the 1.96 standard deviation interval.