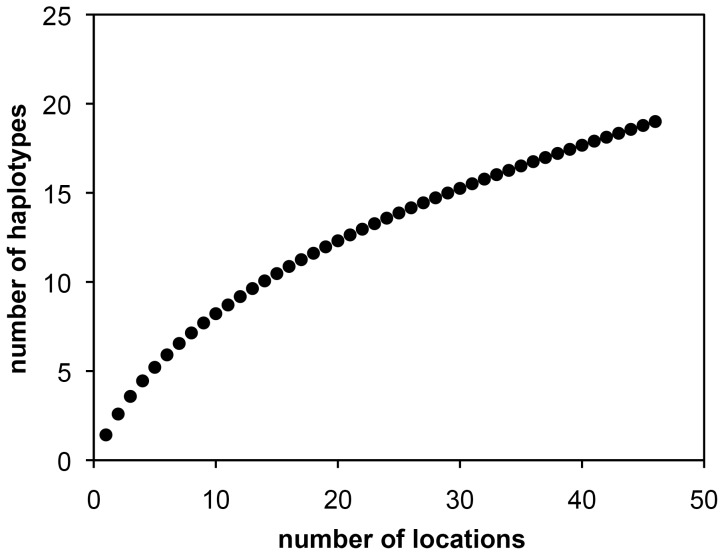
Figure 6. Coleman rarefaction curve.
The total number of different haplotypes is plotted against the number of genetically screened locations. A slight saturation effect is apparent starting at seven locations and eight haplotypes. The slope of the curve is, however, artificially reduced as continuously re-sampling of the two most frequent lineages occurs (H2 and H4). Both haplotypes together have been found in 47% of all genetically characterized locations. Extrapolation of the curve estimates the total number of placozoan haplotypes (species) to be higher than some 200.

