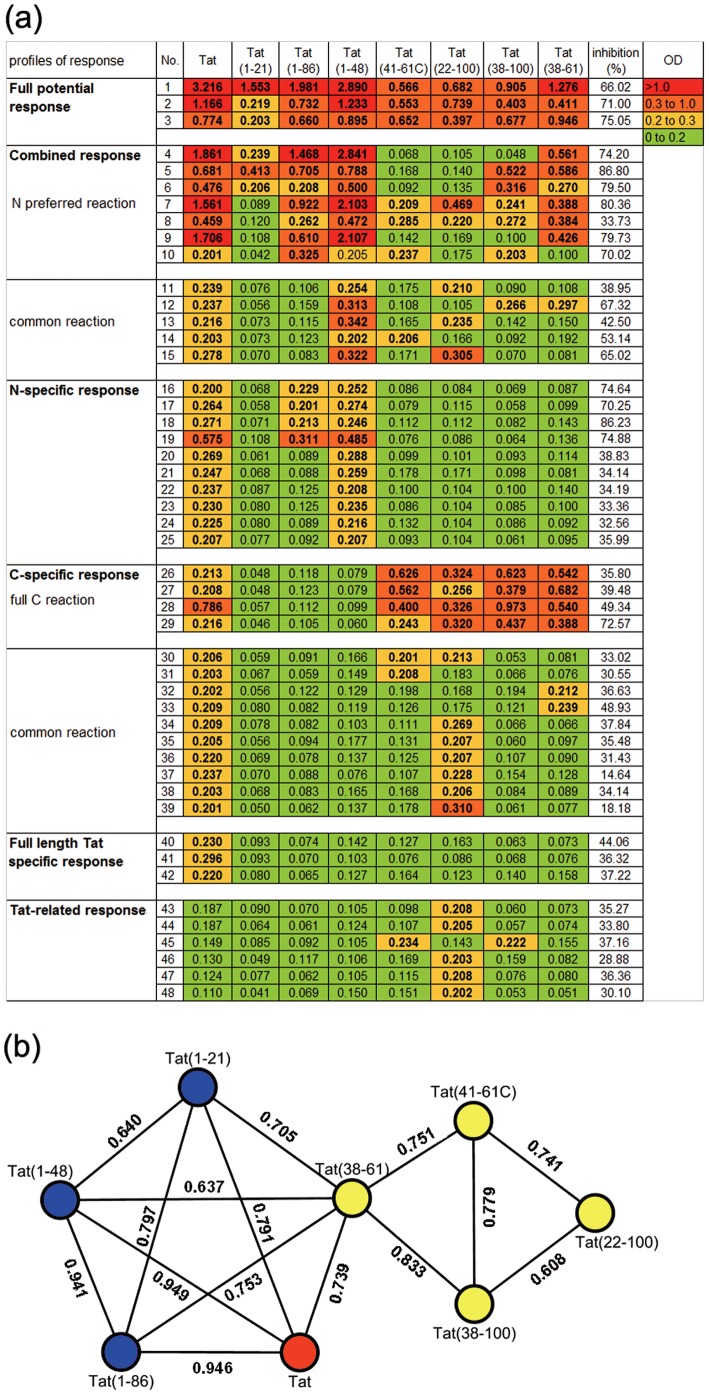
Figure 3. Characteristics of anti-Tat antibody and Tat-neutralizing potential.
(a) Characteristics of reactivity with various analytic antigens and the Tat-neutralizing potential of plasma samples of six profiles. The reactivity of each plasma sample with the peptides as assayed by ELISA is presented according to the OD value, as determined by duplicate measurements. Individual values are shown in color, as indicated in the top right corner, with red representing the strongest reaction. The OD values of twelve HIV-1-seropositive and anti-Tat-seronegative plasma samples and 18 plasma samples from healthy blood donors were included as negative controls, which were showed in Table S3. “No.” represents the number of each plasma sample. (b) The correlation analyses between eight analytic antigens based on antibody responses. The correlations with correlation coefficient (R) more than 0.6 and p-value less than 0.05 are shown.

