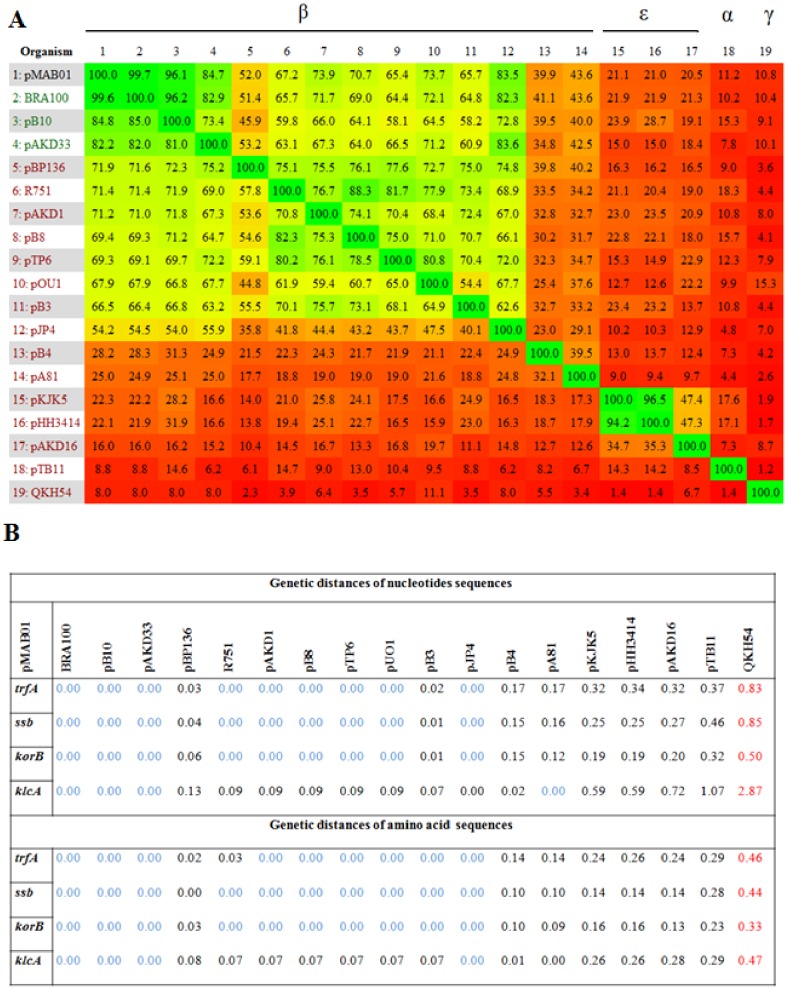
Figure 3. Heat-plot of the identity and genetic distance matrices between pMAB01 and the other 18 IncP-1 plasmid sequences.
(A) Identity matrix generated from complete plasmid genome sequences; the heat-plot is based on a fragmented alignment constructed using BLASTN. (B) Genetic distance matrix obtained with nucleotide and amino acid sequences from genes trfA, ssb, korB and klcA; the plasmid with the greatest distance to pMAB01 is shown in red, and the smallest distances are shown in blue for each gene.

