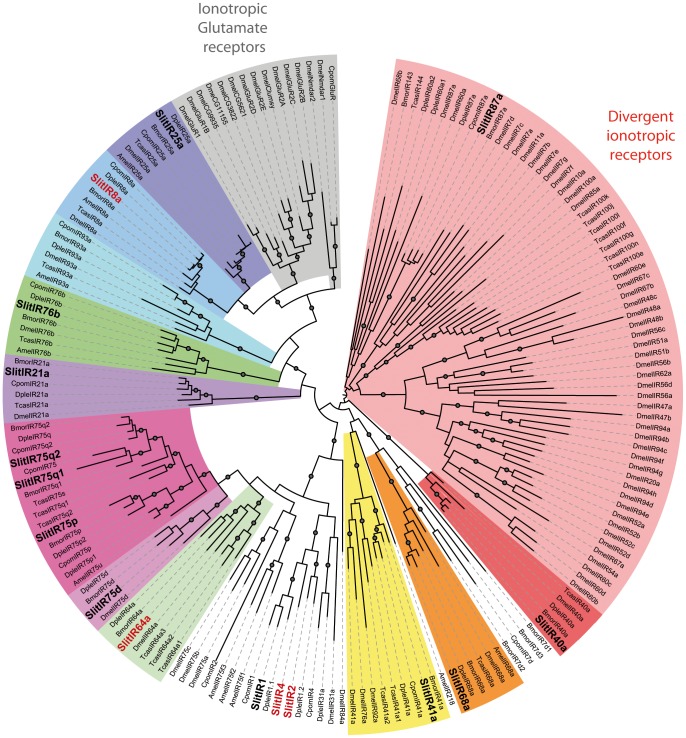
Figure 4. Maximum likelihood tree of candidate ionotropic receptors (IRs) from S. littoralis and other insects.
Sequences used were from B. mori [11], C. pomonella [39], D. plexippus [40], D. melanogaster, Apis mellifera and Tribolium castaneum [11]. Branch support was estimated by approximate likelihood-ratio test (aLRT) (circles: >0.95) [70]. Images were created using the iTOL web server [89]. SlitIRs are in bold and the new SlitIRs identified in this study are in red.

