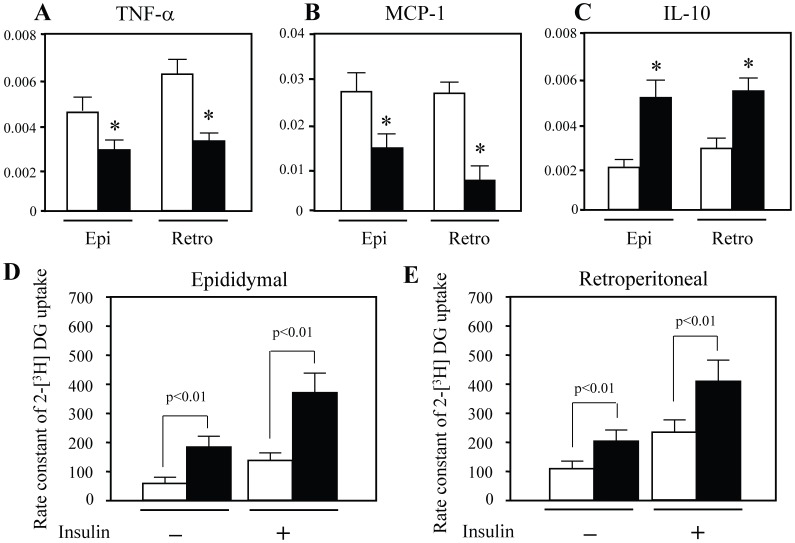
Figure 2. Cytokine levels and glucose uptake in WAT of ATIP1-Tg and WT after treatment with high-cholesterol diet.
(A) Expression of TNF-α, MCP-1 and IL-10 in epididymal (Epi) and retroperitoneal (Retro) WAT. Open squares; WT, closed squares; ATIP1-Tg. n = 7–8 for each group. *p<0.05 vs. WT. (B) Rate constant of 2-[3H] DG uptake in epididymal and retroperitoneal WAT was determined with and without insulin (1.0 U/kg) injection. Open squares; WT, closed squares; ATIP1-Tg. n = 6 for each group.

