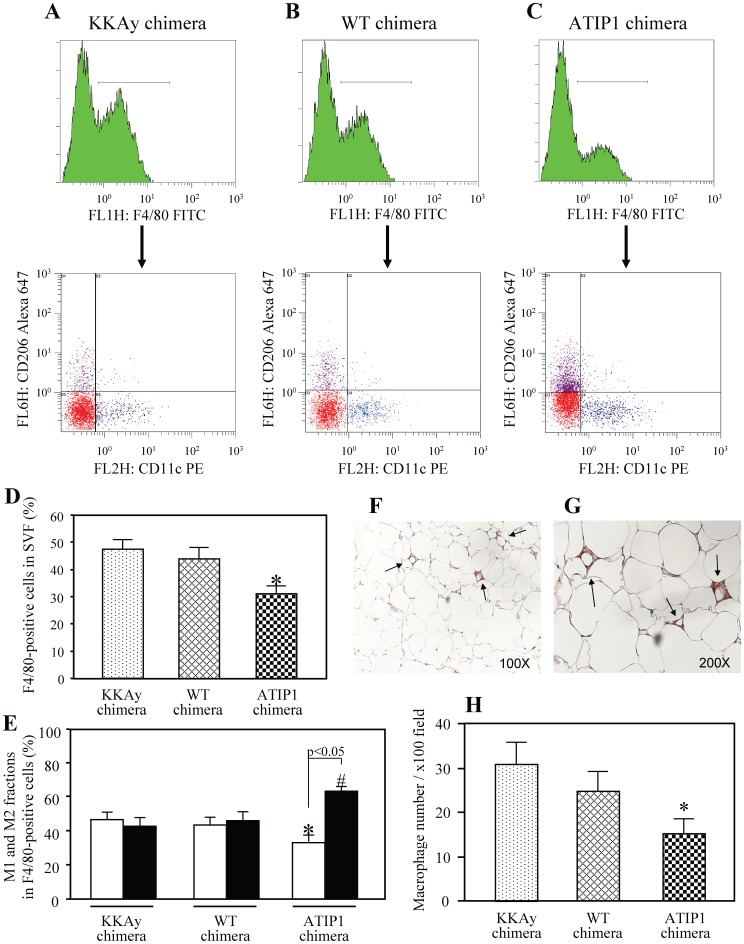
Figure 5. Comparison of macrophage infiltration and polarization in epididymal WAT of chimeric mice.
Cells in the stromal vascular fraction (SVF) of the epididymal fat pad from each mouse were analyzed by flow cytometry as described in “Methods”. (A) Representative results of flow cytometry. F4/80-positive cells were further analyzed with anti-CD11c and anti-CD206 antibodies. Blue dots show M1 macrophages and purple dots show M2 macrophages. Red dots represent both CD11c- and CD206-negative fraction evaluated using isotype controls. (B) Percentage of F4/80-positive cells in SVF. n = 5 for each group. *p<0.05 vs. KKAy chimera and WT chimera. (C) Ratio of M1 and M2 fraction in F4/80-positive cells. Open squares; M1 fraction, closed squares; M2 fraction. *p<0.05 vs. M1 fraction in KKAy chimera and WT chimera, #p<0.05 vs. M2 fraction in KKAy chimera and WT chimera. n = 5 for each group. (D) Immunohistochemical staining of F4/80 in epididymal WAT at low (×100) and high (×200) magnification. Sections from epididymal fat pads of chimeric mice were stained with anti-F4/80 antibodies, followed by DAB staining. F4/80-positive cells are observed as localized macrophage clusters (arrow). Histogram of macrophage number per field at ×100 magnification is shown in the lower panel. n = 6 for each group. *p<0.05 vs. KKAy chimera and WT chimera.

