
Figure 5. The force-extension response for different number of polymers under controlled displacement loading conditions.
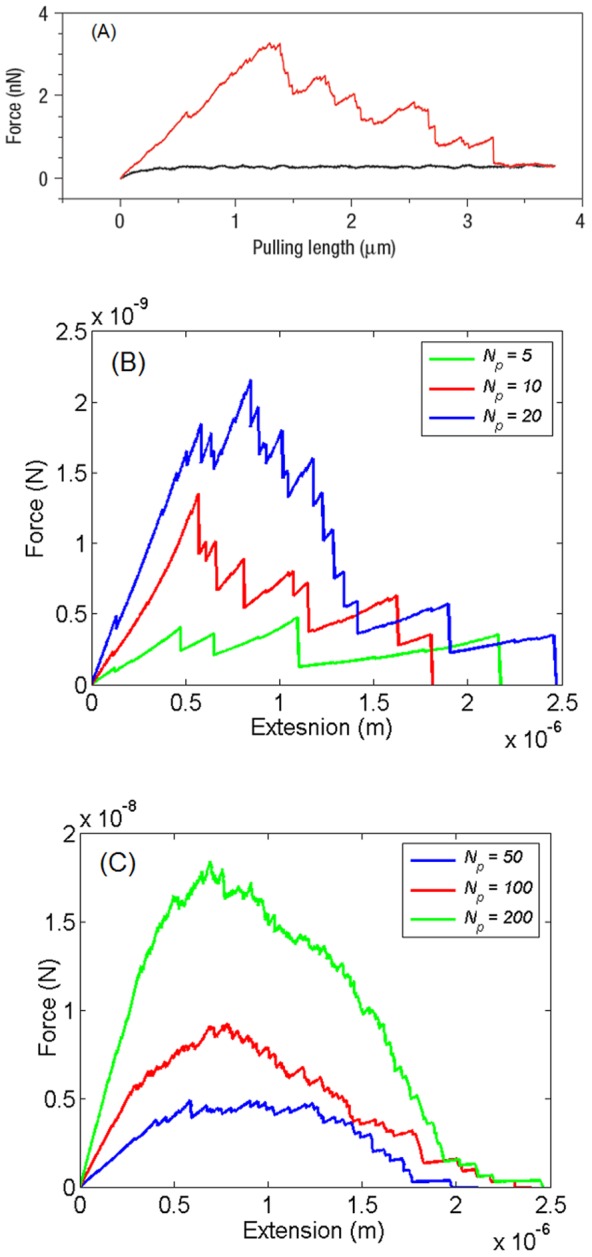
(a) Representative pulling curve observed in AFM experiments on dentin molecules (reprinted with permission from [35]) (b) Representative curves illustrating force-extension response for 5, 10 and, 20 polymers. The smaller force drops correspond in most cases to the breakage of sacrificial bonds while the larger force drops typically represent the detachment of polymer chains. The curve shows similar features to the plot in (a) suggesting that only a few chains are being pulled simultaneously during the AFM experiment. (c) The force extension plot for the polymeric gel when the number of polymer chains is large. The curves look much smoother than the curves in (b).