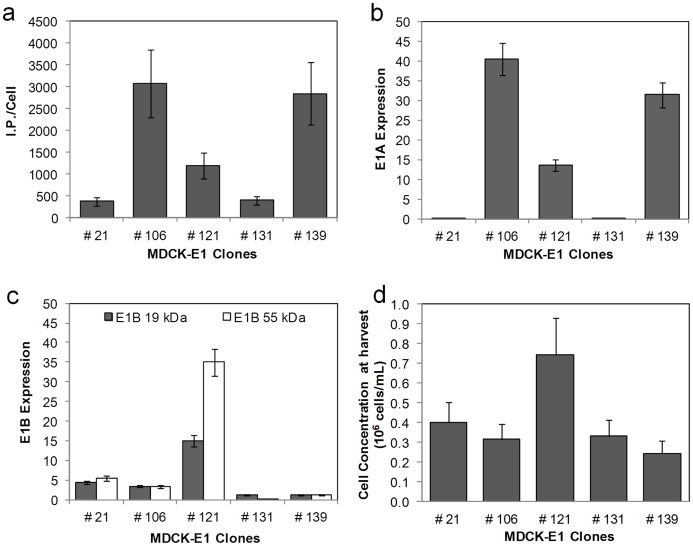
Figure 2. Cell specific productivity and corresponding E1 gene expression of MDCK-E1 cell clones.
a. Cell specific infectious viral titer produced in MDCK-E1 clones using DMEM 10% (v/v) FBS and 1% (v/v) NEAA. Error bars represent a 25% inter-assay variability error. b and c. Levels of mRNA E1A (b) and E1B expression (c) obtained for the different MDCK-E1 clones. The gene expression was determined by Real Time reverse transcriptase PCR and normalized to the housekeeping gene (GAPDH). Error bars represent a 10% variability error associated with the method. d. Cell concentration obtained for the different MDCK-E1 clones at virus harvest time. Cells were infected at the same cell concentration. Error bars represent the standard deviation of three independent experiments (n = 3).

