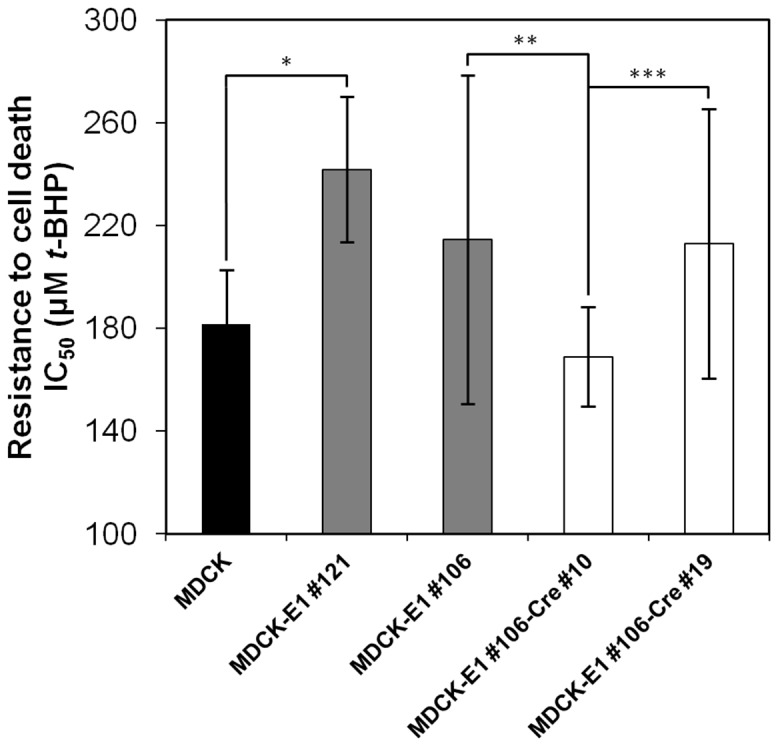
Figure 6. Half maximal inhibitory concentrations (IC50) of MDCK-E1 and MDCK-E1-Cre cell clones in response to increasing concentrations of tert-butyl hydroperoxide (t-BHP) (causing oxidative stress injury) in the culture medium.

MDCK-E1#121 and MDCK-E1#106 represent high and low E1B expression, while MDCK-E1#106-Cre#10 and MDCK-E1#106-Cre#19 represent high and low Cre-activity, respectively. Error bars correspond to standard-deviation of quadruplicate assays. *p<4×10⁻⁵, **p<0.05, ***p<0.04, indicating the significance of a single factor Anova analysis.
