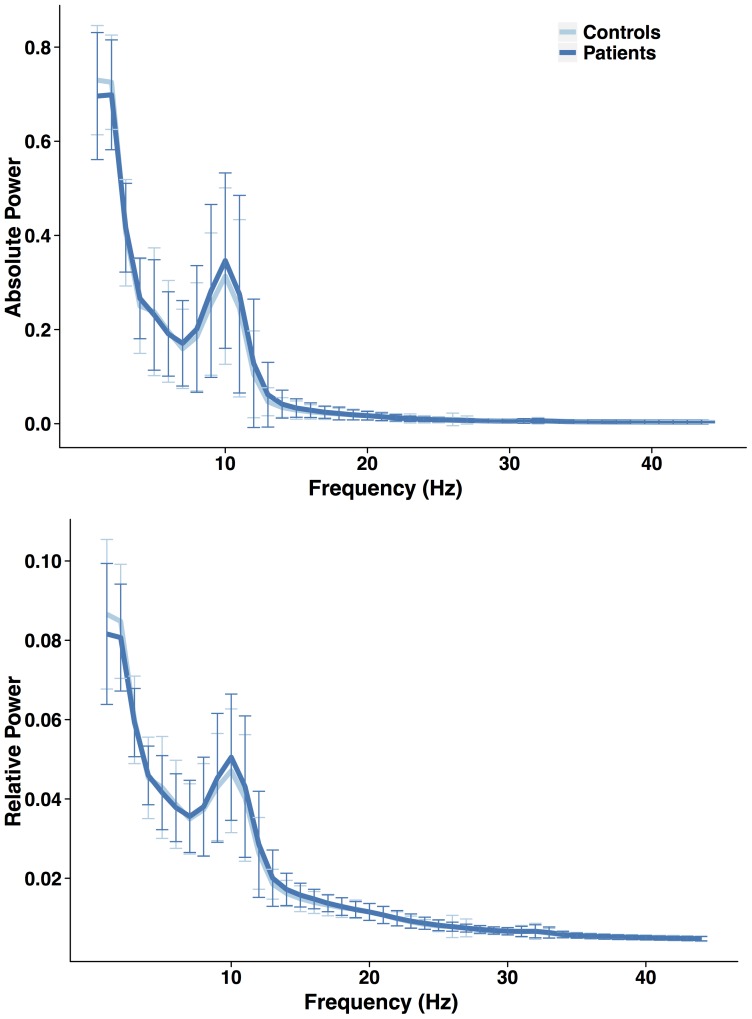
Figure 1. (power spectral density plots of patients and controls).
Mean absolute and relative power spectral densities between 0 and 45 Hz averaged over epochs and subjects per group. Variation, defined as the standard deviation, is indicated by cross bars. Spectral densities between groups largely overlap.

