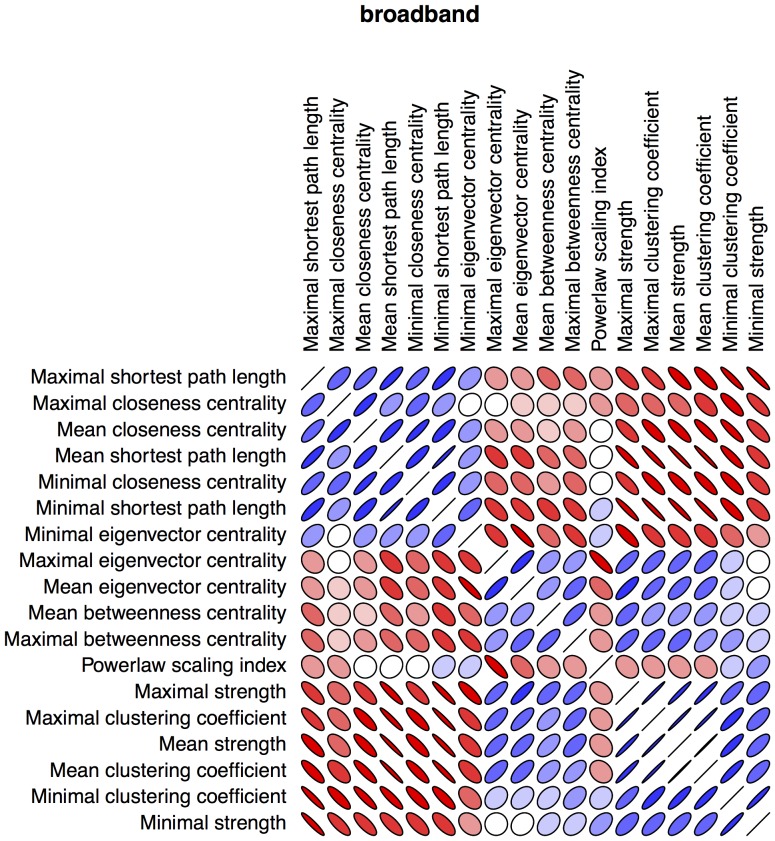
Figure 3. (correlation matrix included network characteristics).
Pearson correlation matrix of all network characteristics for the broadband frequency. Red color indicates positive correlation, blue color indicates negative correlation. Tensor anisotropy indicates strength of correlation (0 correlation, circular; full correlation, single line).

