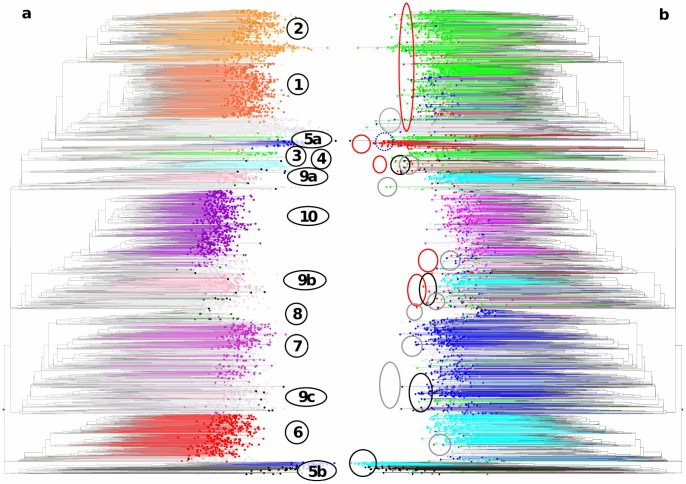
Figure 4. Hierarchical NJ cluster analysis of 3367 sorghum accessions of a global composite germplasm collection based on allelic data from 41 SSR markers (simple matching distance).
a- Accessions grouped by Bayesian analysis (Figure 3, K = 10) are represented in color, corresponding to Group 1 in orange, Group 2 in light orange, Group 3 in light green, Group 4 in light blue, Group 5 in dark blue, Group 6 in red, Group 7 in light purple, Group 8 in dark green, Group 9 in pink, and Group 10 in purple. NJ clustering enabled finer resolution of these groups, leading to subdivisions into Group 5a and Group 5b in dark blue, Group 9a, Group 9b and Group 9c in pink. Unassigned accessions are presented in grey. Wild accessions are presented in black. b- Accessions coloured according to their classification in various taxonomic components: Bicolor in red, Caudatum in dark blue, Durra in green, Guinea in light blue, Kafir in purple, unclassified in grey, wild in black. The dendrogram sectors including dispersed components accessions (wild/weedy, Bicolor, and unclassified) are highlighted by circles of the corresponding colours (black, red, grey).

